A percentage about continued treatment can look like a forecast of how a care plan will unfold. Before using it that way, unpack the question it answers. Was someone still being observed, still receiving the intervention, or continuously exposed throughout the period? These descriptions concern different information. A useful reading starts by separating them, before deciding whether any number belongs in a personal planning conversation.
The figure below provides a concrete research example. The analysis that follows develops our editorial framework for interpreting status tables: identify the record, identify the population, and identify the time being described. The classroom, equipment and library examples are deliberately fictional and nonclinical. They illustrate mathematical and measurement problems; they are not additional findings about semaglutide, patient experiences or forecasts of treatment costs.
Reading the evidence
- Name the measured state
- Continued observation, current exposure and an uninterrupted history require different evidence.
Sources: Wharton 2022
- Keep the denominator attached
- A proportion describes the group used to calculate it. Changing that group changes the question.
Sources: Wharton 2022
- Separate a snapshot from a history
- An endpoint status does not encode every transition that occurred before it.
Sources: Wharton 2022
- Ask for linked records
- Two group totals do not automatically reveal which individuals belong to both groups.
Sources: Wharton 2022
- Use the appropriate document
- Research observations, clinical decisions and payment obligations need their own supporting records.
Sources: Wharton 2022; Wegovy label
Two different endpoint statuses
Weekly subcutaneous treatment; subgroup combined dose reduction and temporary interruption.
The rows answer separate questions and should not be added or treated as a sequence.
Sources: Wharton 2022
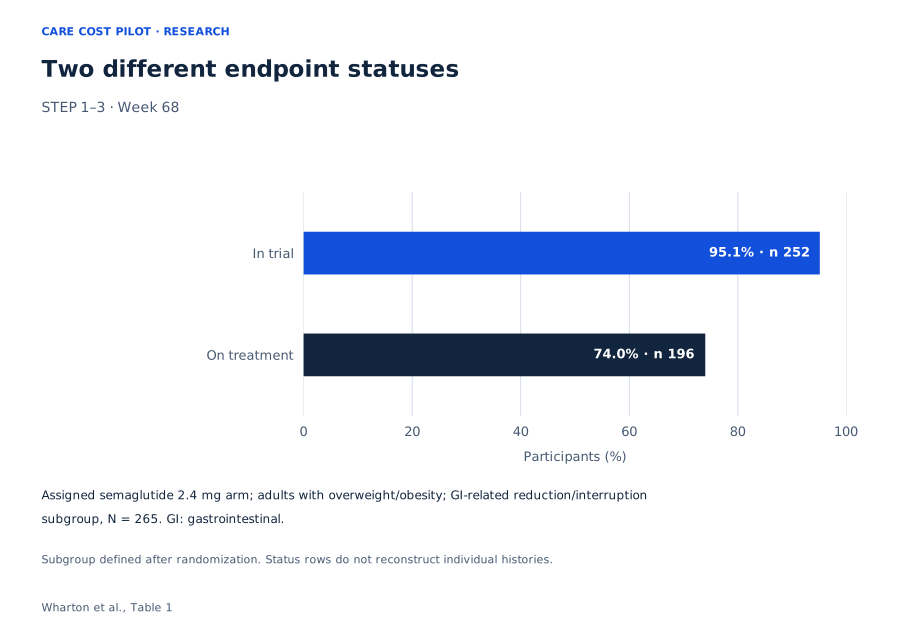
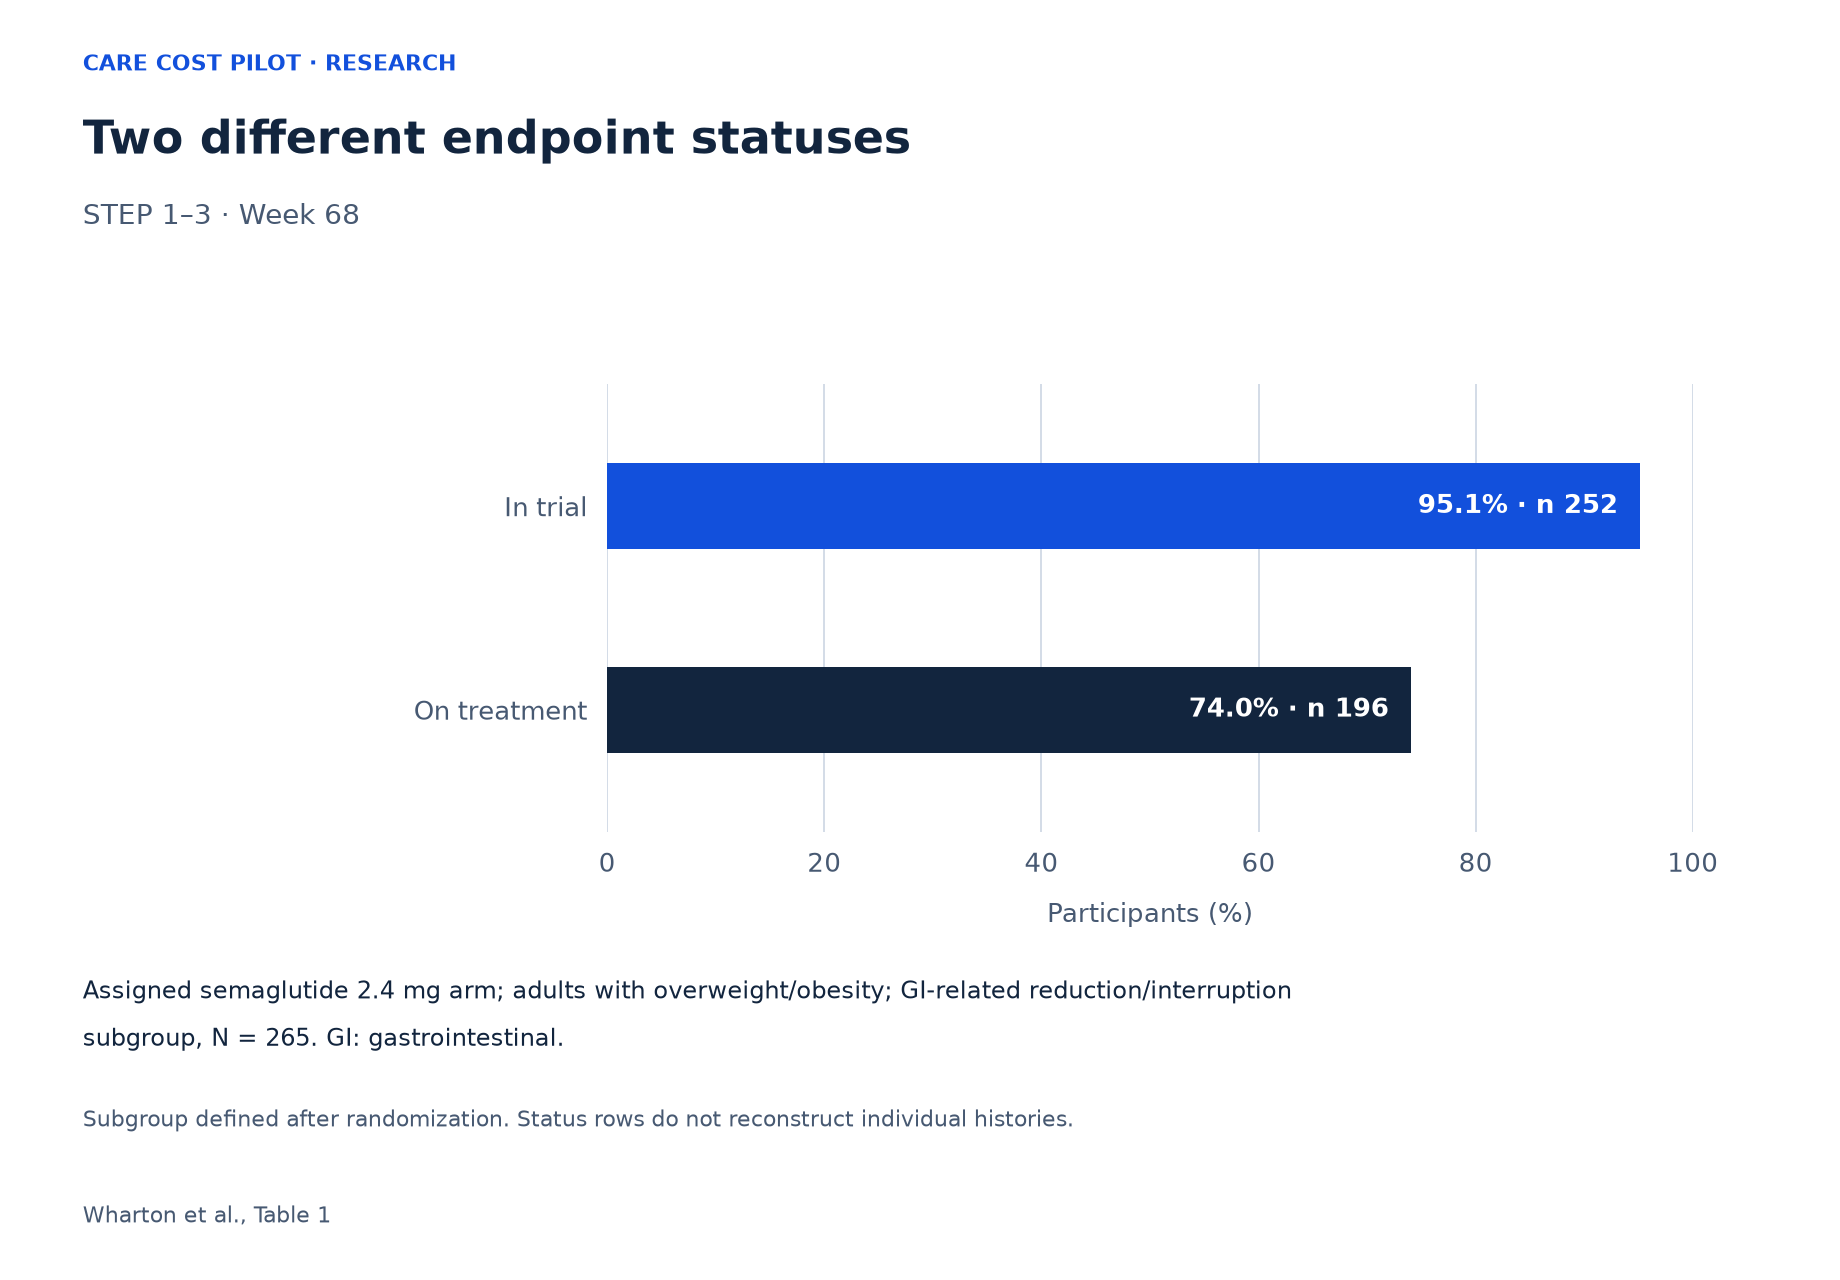
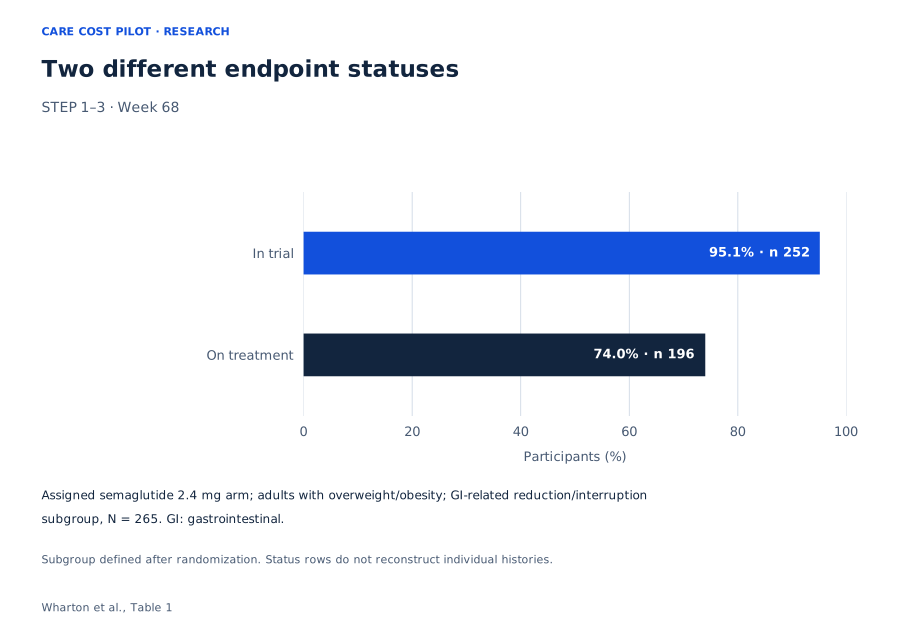
Assigned semaglutide 2.4 mg arm; adults with overweight/obesity; GI-related reduction/interruption subgroup, N = 265. GI: gastrointestinal.
| Status | Participants | Percent |
|---|---|---|
| In trial | 252 / 265 | 95.1% |
| On treatment | 196 / 265 | 74.0% |
Begin with a question that the table can answer
Wharton et al. used a post hoc pooled analysis. The plotted subgroup was selected after randomization, not assigned an interruption strategy. Novo Nordisk funded the trials; three authors were employees and shareholders.
Our reading begins with the labels, not the height of a bar. Treat every endpoint as a sentence with several missing words: this proportion of this population met this definition at this time. Filling those spaces prevents a familiar term such as participation from carrying several meanings at once. The word continued, for example, needs an object. Continued contact with researchers and continued exposure to an intervention are distinct propositions. A report can document one without documenting every detail of the other.
The same discipline applies to purpose. An endpoint table can describe observed status without supplying a strategy for producing it. To evaluate a strategy, a reader would need an appropriate comparison and a defensible account of why the groups differ. Funding and author affiliations belong in that appraisal, alongside design and reporting. Neither a commercial relationship nor a reassuring percentage removes the need to examine how the question was constructed. Keep a brief question beside the table, then check whether each required part is actually recorded.
Sources: Wharton 2022
Build a dictionary before comparing records
A status dictionary defines what each record means before counting begins. In our editorial framework, enrollment is an entry condition, contact describes an observation process, and exposure describes the activity under study. None is a substitute for the others. A dated roster can establish that someone entered a project. It cannot, by itself, establish that the person attended throughout, answered every question, or completed the intended activity. Those conclusions require additional records with their own dates and definitions.
This is a practical way to read a table, rather than a demand for unlimited detail. Write down the narrow conclusion each available field supports and the larger conclusion it leaves open. If a summary uses an ambiguous label, preserve that ambiguity in your notes instead of silently selecting the interpretation that suits your decision. A parallel distinction appears when comparing an initial charge with later payments: our guide to first payment and renewal cost helps separate those financial records. That analogy concerns clear definitions; it does not convert a financial record into a clinical measure.
| Recorded item | Evidence needed | Conclusion still unavailable |
|---|---|---|
| Entry into a project | A dated enrollment record | Participation at every later point |
| Contact at an endpoint | A defined contact or assessment record | Continuous exposure before that contact |
| Current exposure | A dated record of the studied activity | An uninterrupted history |
| Resumption after a gap | Linked records before and after the gap | Why resumption occurred or what it achieved |
Sources: Wharton 2022
Use a fictional example to test overlapping totals
Consider an invented training project with thirty enrolled learners. Twenty-four return a final survey, while eighteen are recorded as currently attending the course. These are fictional counts chosen to illustrate arithmetic, not observations from a clinical trial. The first fraction uses survey return as its numerator; the second uses current attendance. Both can use the enrollment roster as their denominator while describing different outcomes. The shared denominator makes the scale comparable, but it does not make the categories interchangeable.
How many learners both returned the survey and attended? From these totals alone, the overlap could range from twelve to eighteen. Twelve is the smallest overlap that fits all the learners into a roster of thirty; eighteen is the largest because the smaller group cannot contribute more members than it contains. Subtracting the two totals would therefore fail to identify a particular group of people. A linked attendance-and-survey record would answer the membership question. This example shows why arithmetic and identification are separate tasks: calculating a difference is easy, but knowing whom it describes requires information beyond the margins.
Sources: Wharton 2022
Ask how a subgroup came into existence
A group can be defined at entry or created later by an event. These choices change the population to which a proportion refers. Imagine a fictional teaching experiment that assigns learners to two course formats. Later, an analyst examines only learners who requested extra tutoring. The original assignment process does not assign people to the later tutoring-request group. Motivation, available time or difficulty might influence that request; these are hypothetical possibilities, not established explanations for a clinical finding.
The appropriate response is to specify the new question. A description of people who experienced a particular event can be useful without estimating what would happen if everyone were instructed to experience it. Ask when the selection rule operated and whether the intended comparison requires information that selection discarded. This also prevents treating a subgroup as a miniature copy of the full starting population. Our companion article on tirzepatide follow-up and leaving a trial develops a separate example of defining outcomes. The connection is the reading method; it is not a comparison of drug performance.
Sources: Wharton 2022
Distinguish an endpoint photograph from a timeline
Here is another invented, nonclinical example. Two devices are inactive at the end of a thirty-day observation period. Device A stopped on day three, restarted on day ten, and stopped again on day twenty-nine. Device B operated until day twenty-nine and then stopped. The endpoint photograph looks the same, but the histories contain different operating periods and transitions. Nothing in the final inactive label reconstructs those earlier paths.
A question about current status needs a defined assessment time. A question about duration needs dated intervals, together with rules for counting partial days and gaps. A question about uninterrupted activity needs a complete enough history to identify interruptions. It would be a mistake to answer all three with one endpoint field. Before interpreting persistence, specify which of these meanings you intend. Then identify the observation schedule required to support it. This exercise does not suggest that trial participants followed either fictional device history; it demonstrates the information that any status-only summary leaves unspecified. The distinction matters even when every reported endpoint value is accurately measured.
Sources: Wharton 2022
Keep the population and the time window together
A denominator is a definition of whose experience enters the calculation. An observation window defines which part of that experience is eligible to count. These decisions work together. Suppose an invented reading project reports attendance only among members who reached a scheduled review. A fraction based on that selected set answers a different question from a fraction based on everyone who joined. Even a perfectly calculated percentage cannot erase the change in population.
Time adds another choice. Measuring activity at one appointment differs from counting any activity during an interval or totaling active days. A reader should be able to express the chosen outcome in ordinary language before interpreting its precision. When comparing documents, first align these definitions; avoid ranking unlike percentages merely because they share a percent sign. Our provider quote comparison guide applies a related discipline to financial documents: establish what each figure includes before comparing it. Here the scientific task is narrower—identify the counted population, the event definition and the time rule. Only then ask what decision that specific combination could inform.
A small fictional arithmetic check illustrates why group sizes matter. Suppose two classrooms have completion counts of two out of four and ninety out of one hundred. Giving their percentages equal weight treats the classrooms as equally large units. Combining their learner counts answers a different question about all learners together. Neither operation should be chosen simply because it is convenient. Name the unit being summarized before choosing the calculation, and keep this teaching example separate from the clinical figure.
Sources: Wharton 2022
Locate missing information instead of filling it by assumption
In a fictional library project, a reader returns an end-of-month questionnaire but skips the weekly reading logs. The final response establishes that an observation occurred at the endpoint. It does not reveal the missing weekly answers. Nor does the existence of those missing logs tell us whether the reader read more or less than someone who completed every entry. Several histories remain compatible with the available record.
Analysis must therefore distinguish a recorded negative answer from an unavailable answer. Treating both as zero creates a new assumption about the missing observations. Restricting a calculation to complete records creates a different question about a selected set. Neither choice becomes self-explanatory because software can perform it. Ask which records are missing, what rule handles them, and how the conclusion might depend on that rule. For budgeting, the analogous habit is to leave an unquoted item unresolved until its terms are documented; see monthly and prepaid payment commitments. An unknown clinical observation and an unknown charge are different problems, but neither is solved by silently entering a convenient value.
| Available information | Unresolved question | Additional record needed |
|---|---|---|
| A final questionnaire | What happened during unrecorded weeks? | Dated intermediate observations |
| A current activity status | Was activity continuous? | A sufficiently complete activity history |
| Separate totals for two categories | Who belonged to both? | Linked category membership |
| A selected-group percentage | What describes everyone at entry? | An analysis with the intended starting population |
Sources: Wharton 2022
Keep observation records separate from payment records
Our planning interpretation uses two sets of questions. Scientific records describe how an observation or activity was defined and measured. Contractual records describe what a payment covers and what changes the obligation to pay. A receipt, a dispensing record, an appointment entry and an endpoint measurement can each be accurate while referring to different events. Their dates may be relevant to a discussion, but matching dates alone does not make them equivalent measures.
Before putting a study percentage into a budget, identify the missing connection. What written term links the event you are considering to a charge, a renewal or a refund? Without that document, the percentage cannot supply the billing rule. A useful worksheet keeps the clinical question and the contract question on separate lines, with a responsible source for each answer. The questions to ask before paying for online care offer a starting point for the documentary side. This is a method for organizing evidence, not a claim about any particular provider or a prediction that a specific event will occur.
Sources: Wharton 2022
Use provider reviews as routes to documents
A provider review can help organize the next question without functioning as evidence for a clinical outcome. Read its source dates and follow the relevant documents, then obtain the terms that apply to the actual offer being considered. The research question and the purchasing question may concern the same person, but they still require different support. An average from a study does not authenticate a contract, and a detailed contract does not establish a treatment effect.
For documentary comparison, consult our Ro cost review and Mochi Health cost review. These links invite examination of written terms; they do not establish that either service offers the product studied here or reproduces its results. Record the document date, the exact question it answers and anything still awaiting a written response. This makes later revisions easier to interpret. If the offer changes, update the financial assumptions using the new document rather than treating the scientific discussion as a substitute for those terms. A transparent planning process keeps uncertainty visible instead of hiding it inside a single total.
Sources: Wharton 2022
Let clinical information answer the clinical question
Wegovy is contraindicated with personal or family medullary thyroid carcinoma, MEN2, or prior serious hypersensitivity to semaglutide or its ingredients. Its boxed warning concerns thyroid tumors in rodents; relevance to humans remains unknown. The label warns about pancreatitis, gallbladder disease, dehydration-related kidney injury and severe gastrointestinal reactions, and advises against use with severe gastroparesis. Contact a clinician for severe or persistent symptoms; severe persistent abdominal pain needs prompt assessment. Tell the care team about treatment before anesthesia. Trial tables cannot determine a personal stopping or restart schedule.
An evidence-reading worksheet should finish with the question it has clarified, not a self-directed regimen. Specify whether you need a definition, an individual clinical assessment or a written payment term. Then seek the source appropriate to that need. A clear scientific summary can improve the conversation by showing where a proposed conclusion depends on information the table does not contain. That is a useful result in itself. It allows a reader to discuss a plan with fewer hidden assumptions, while keeping the responsibilities of the research report, the clinician and the commercial agreement separate.
Sources: Wegovy label; Wharton 2022
Questions about the evidence
Does a final observation describe the whole journey?
No. A dated observation identifies what was recorded at that point. Describing the path requires records from the intervening period. The device example shows how different histories can end in the same state; it does not model clinical behavior.
Sources: Wharton 2022
Why keep the denominator next to a percentage?
The denominator identifies the population the fraction describes. If you replace a selected group with everyone at entry, you have asked a new question. Keep the group definition and observation window together when comparing summaries.
Sources: Wharton 2022
Can two totals reveal how their members overlap?
Only when additional information establishes the membership relationship. Separate totals are margins, not a linked roster. The fictional training example demonstrates several possible overlaps consistent with the same totals, so subtraction alone cannot identify the individuals in a difference.
Sources: Wharton 2022
Is an unavailable record the same as a negative result?
No. A negative result reports an observation; an unavailable record leaves that observation unknown. Substituting one for the other adds an assumption. Ask how the analysis handles missing information and which question that handling allows it to answer.
Sources: Wharton 2022
What belongs in a care-cost planning worksheet?
Separate the observation you want to understand from the written term governing payment. Identify the source and date for each. Leave unresolved fields visible, and take clinical questions to the care team rather than estimating a personal course from a group summary.
Sources: Wharton 2022; Wegovy label
Editorial assessment
The most useful first step is to rewrite an appealing percentage as a precise question. Identify the population, the measured state, the time window and the evidence needed to connect separate records. This approach preserves the value of a well-defined observation without asking it to describe an unobserved history or determine a contract. For Care Cost Pilot, that separation is the foundation of a more explicit planning conversation: scientific interpretation clarifies the evidence, clinical assessment addresses the person, and written terms establish the payment assumptions.
Sources and access
- Gastrointestinal tolerability of once-weekly semaglutide 2.4 mg in adults with overweight or obesity, and the relationship between gastrointestinal adverse events and weight loss.
Full article and its Table 1 reviewed.
Checked 2026-10-26.
- Gastrointestinal tolerability and weight reduction associated with tirzepatide in adults with obesity or overweight with and without type 2 diabetes in the SURMOUNT-1 to -4 trials.
Full article and supplementary Tables S1 and S3 reviewed.
Checked 2026-10-26.
- DailyMed: WEGOVY semaglutide current prescribing information
Current official prescribing information checked October 26, 2026.
Checked 2026-10-26.
- DailyMed: ZEPBOUND tirzepatide current prescribing information
Current official prescribing information checked October 26, 2026.
Checked 2026-10-26.